Thoughts on code, digital cartography, and technology.


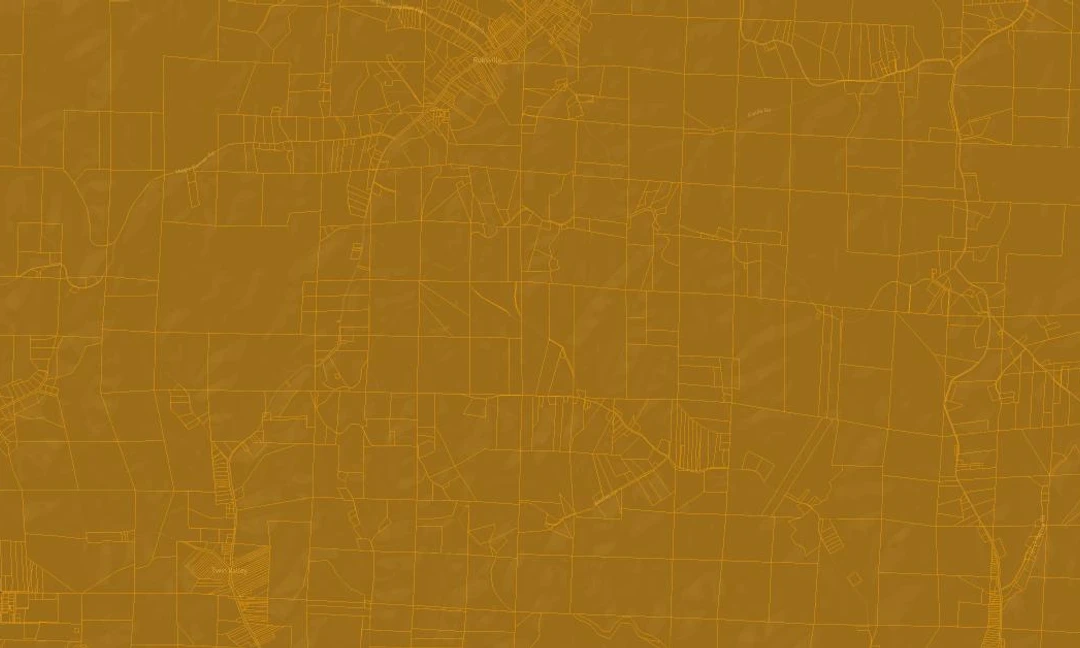
US Forest Service OSM Mashup
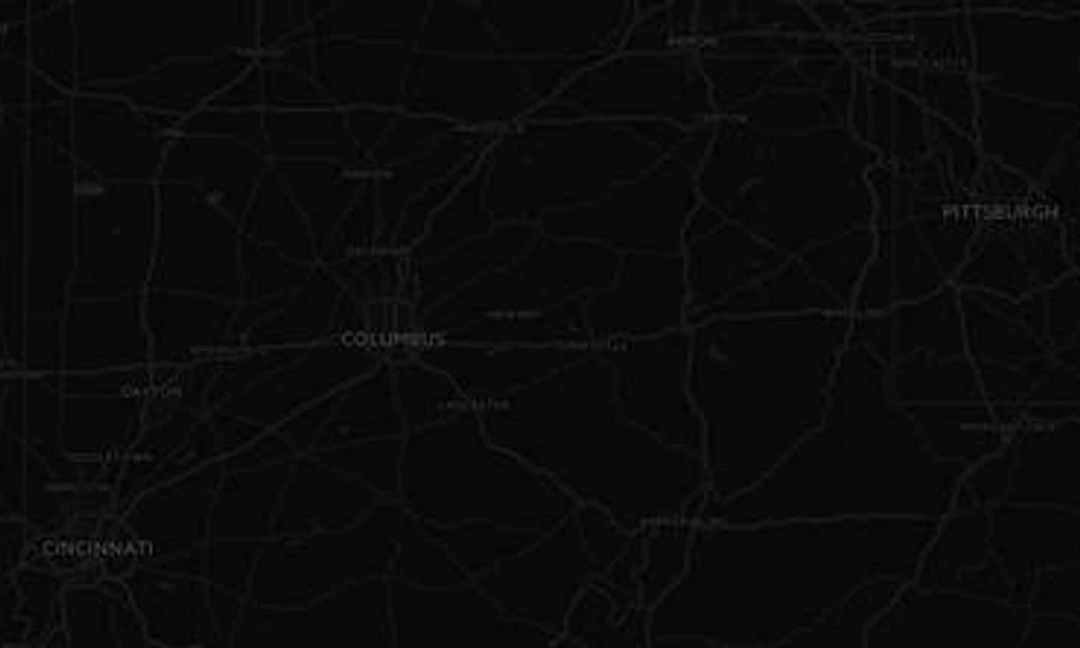
While scoping out my next backpacking adventure via various PDF and web maps, I ran across these US Forest Service vector tile basemaps.
Journal | Read More →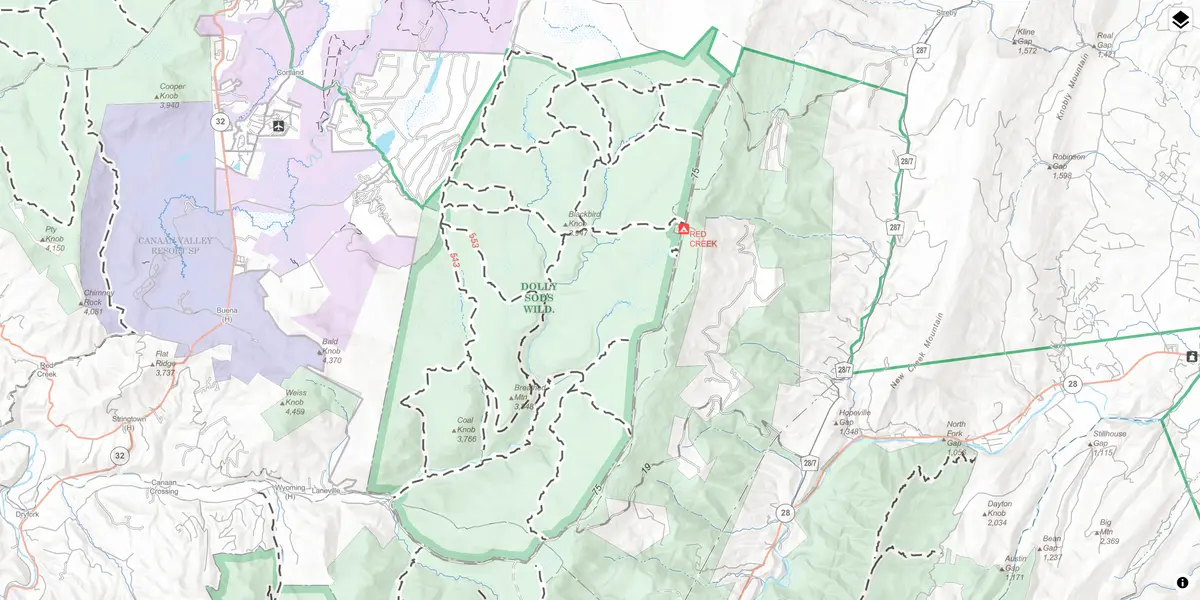
Using GitHub Issues as a Simple Static CMS
Why use a complex CMS when you can use GitHub Issues as a lightweight blogging engine!
Journal | Read More →A Reflection on FOSS4G North America 2025
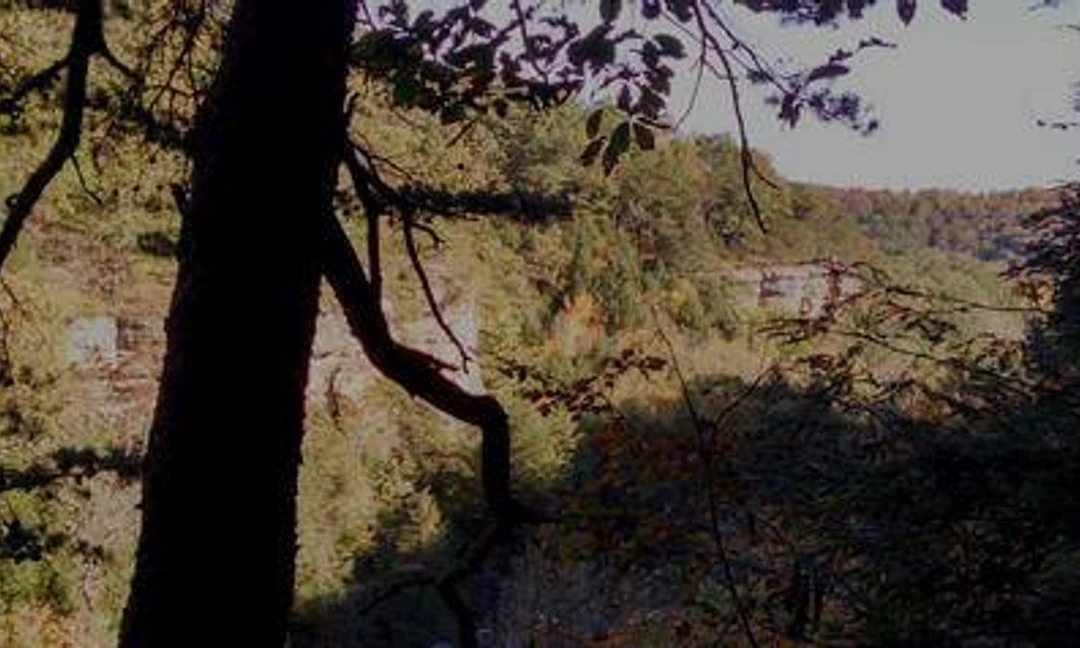
A six-hour drive each way through the hills of West Virginia to our nation’s capital might not be on everyone's to do list, but for my visit to FOSS4GNA it was definitely worth it.
Journal | Read More →
Filtering Arrays in MapLibre
Techniques for Substring Matching in MapLibre GL JS and Mapbox GL JS
Tech Blog | Read More →


Get Audio Info using ffmpeg
ffprobe \
  -v error \
  -select_streams a:0 \
  -show_entries stream \
  -of default=noprint_wrappers=1 \
  "input.m4a" | sed 's/=/:/'
Batch Convert Audio with ffmpeg
for f in *.flac; do ffmpeg -v warning -i "$f" -map_metadata 0 -b:a 192k "${f%.flac}.mp3"; done
Update for May 2025
A look back on what I've been up to over the past four months.
Updates | Update →Update for January 2025
A look back on what I've been up to since my last update.
Updates | Update →ShpShifter
Preview, Convert, and Filter SHP, GPKG, GeoJSON & GeoParquet in the Browser
Tech Blog | Read More →
Mapping Disasters
Find Open Satellite Imagery from Maxar, Capella, Umbra, and Wyvern
Tech Blog | Read More →
Palisades Fire Before and After
A Sample of Available Satellite Data for Post-Disaster Visual Assessment
Tech Blog | Read More →
Disposing an OpenLayers Map
  const layers = map.getLayers().getArray();
  layers.forEach((layer) => {
    const source = layer.getSource();
    if (source && source.dispose) {
      source.clear();
      source.dispose();
    }
    if (layer.disposeInternal) {
      layer.disposeInternal();
    } else if (layer.dispose) {
      layer.dispose();
    }
    map.removeLayer(layer);
  });
  const olCanvas = map.getViewport().querySelector("canvas");
  if (olCanvas) {
    const gl = olCanvas.getContext("webgl") || olCanvas.getContext("webgl2");
    if (gl) {
      const loseContext = gl.getExtension("WEBGL_lose_context");
      if (loseContext) {
        loseContext.loseContext();
      }
    }
  }
  map.getInteractions().clear();
  map.getOverlays().clear();
  map.dispose();
  map.setTarget(null);
Refactor Web Journal
I originally created this site to be a simple web 2.0 blog site with text entries for thoughts that did not fit into my work-related geospatial blog.
Journal | Read More →Deck GL and 3D Tiles
Generate Colorized 3D Tiles from LiDAR and Ortho Imagery
Tech Blog | Read More →
Introducing Ancestral Audio
Using whisper and AI to transcribe audio and generate thematic clips
Journal | Read More →Finding Perpendicular lines with TurfJS
Bearing, LineIntersect & Destination
Tech Blog | Read More →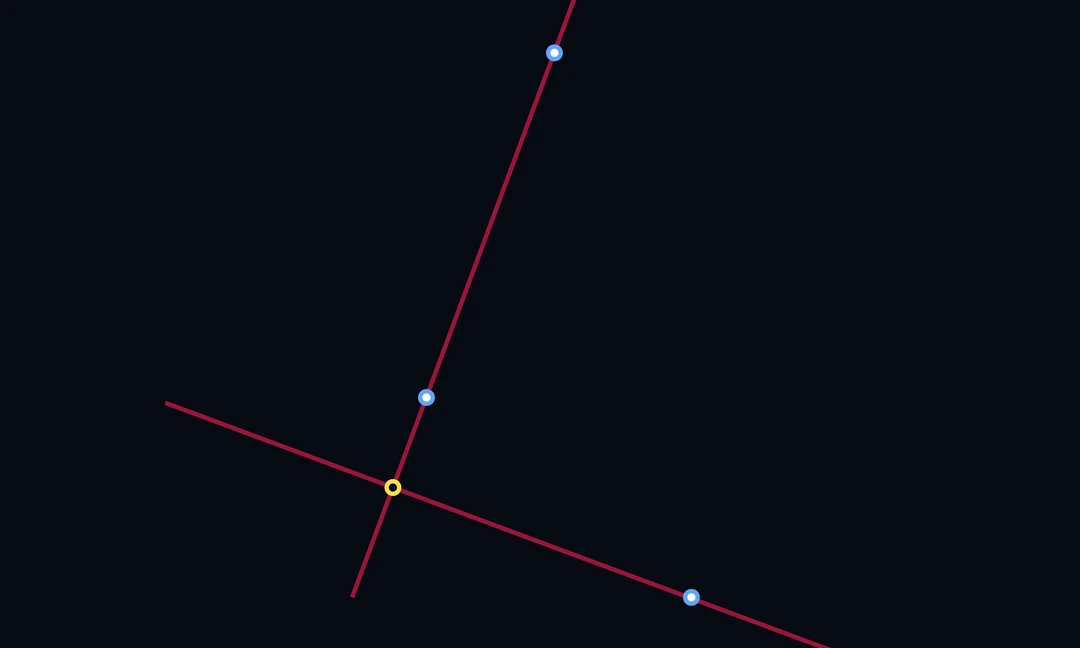
MapCompare
Rendering Comparisons of Vector Tiles and COGs in Web Mapping Libraries
Tech Blog | Read More →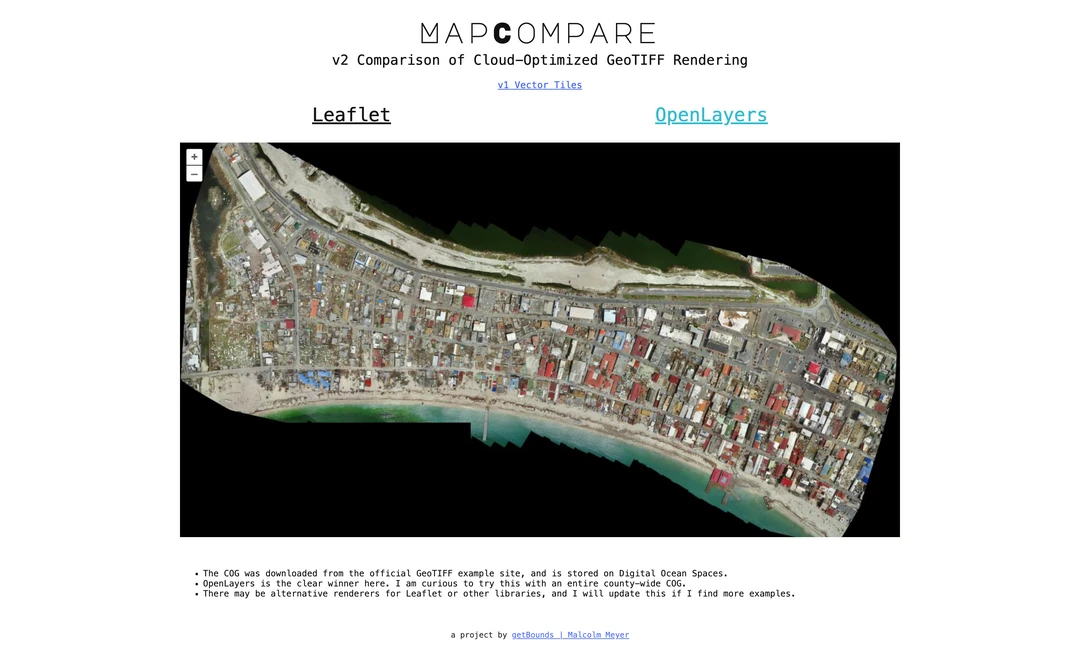
GeoJSON Network Trace Tool
Trace a GeoJSON Linear Network in the Browser
Tech Blog | Read More →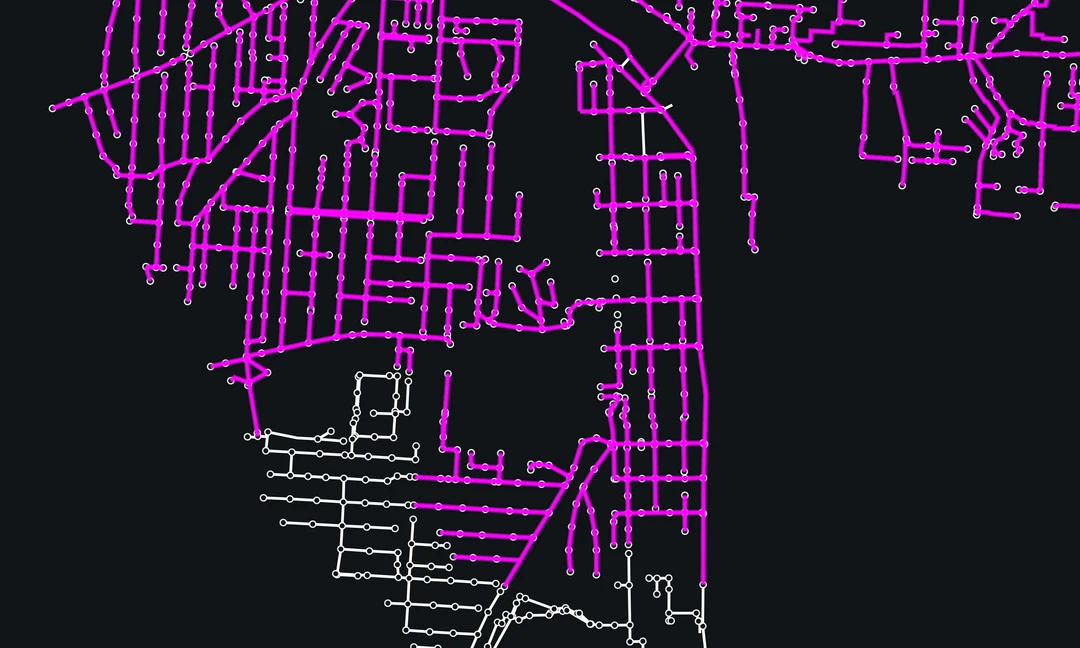
Potocki Vodka Store Finder
A Responsive Map-Focused Store Finder
Tech Blog | Read More →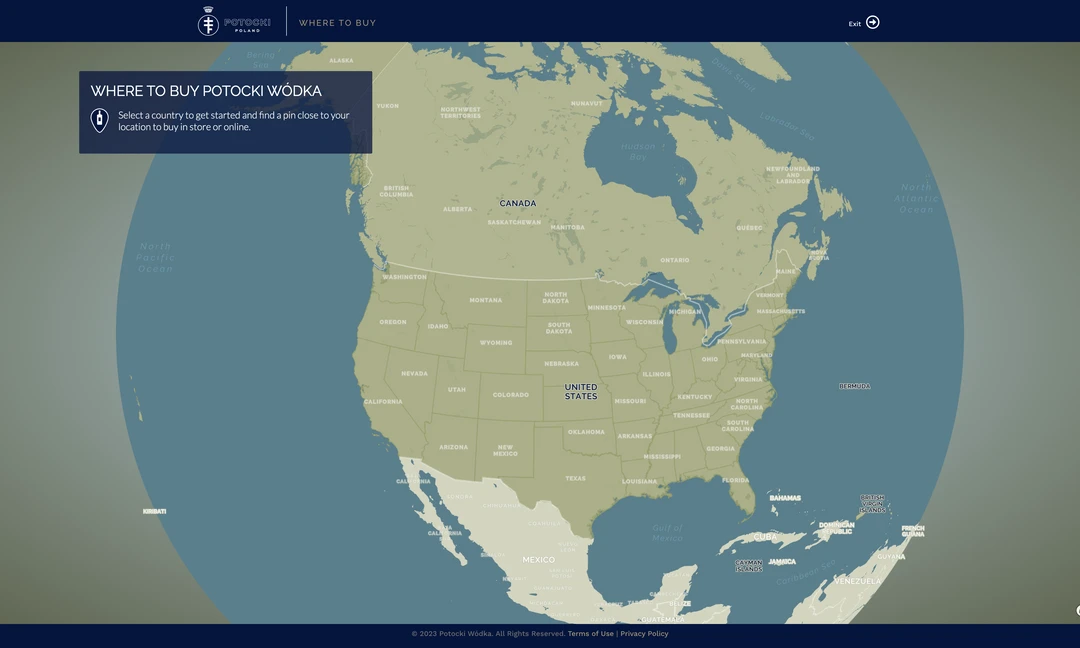
Serverless Web Maps
Using SQLite in the Browser and Service Workers to Power Web Maps from Object Storage
Tech Blog | Read More →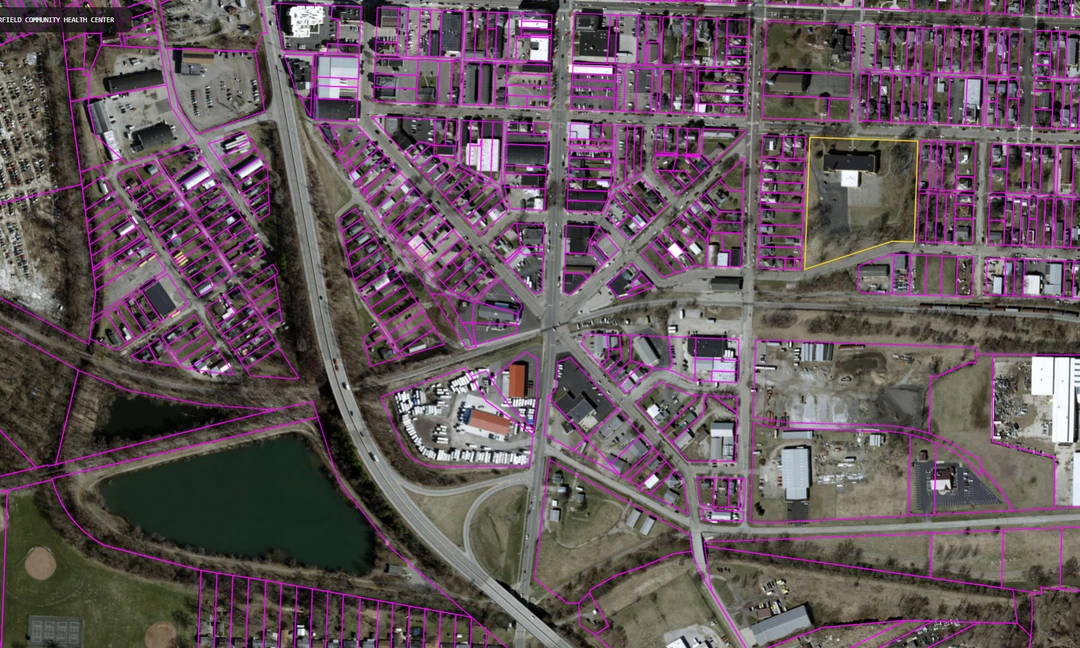
City of Lancaster Public Transit
A NodeJS GTFS Feed & Interactive Map Generator
Tech Blog | Read More →Peaks 3D Visualization
An Exporation of the Highest Mountain Peaks in the US
Tech Blog | Read More →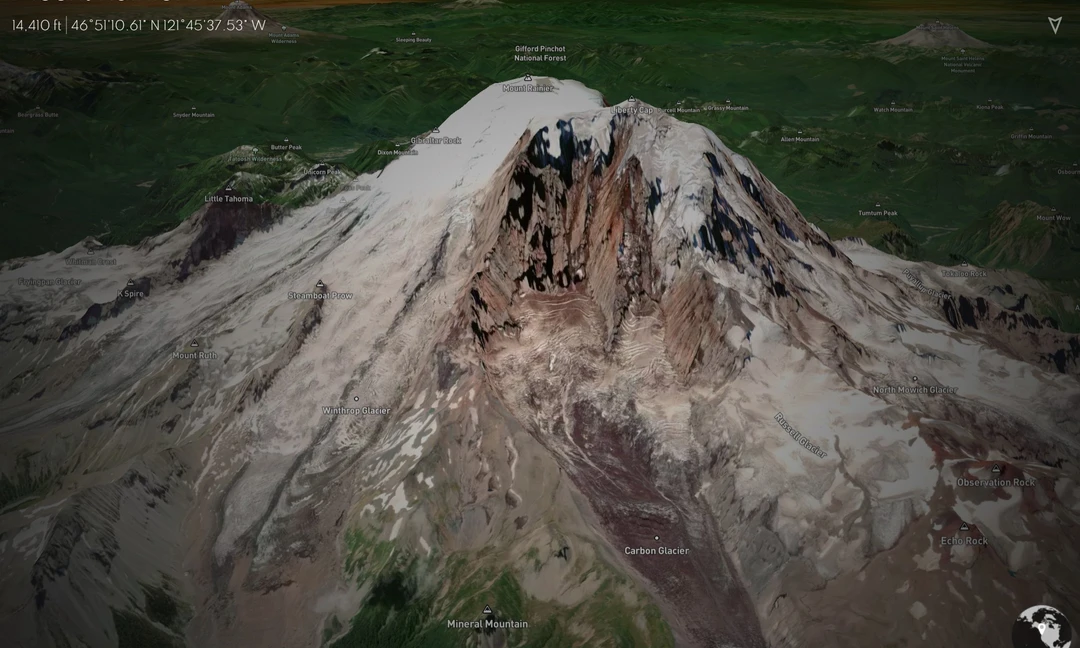
Export GeoJSON from PostgreSQL using Beekeeper Studio
Query > Download > Copy > Paste!
Tech Blog | Read More →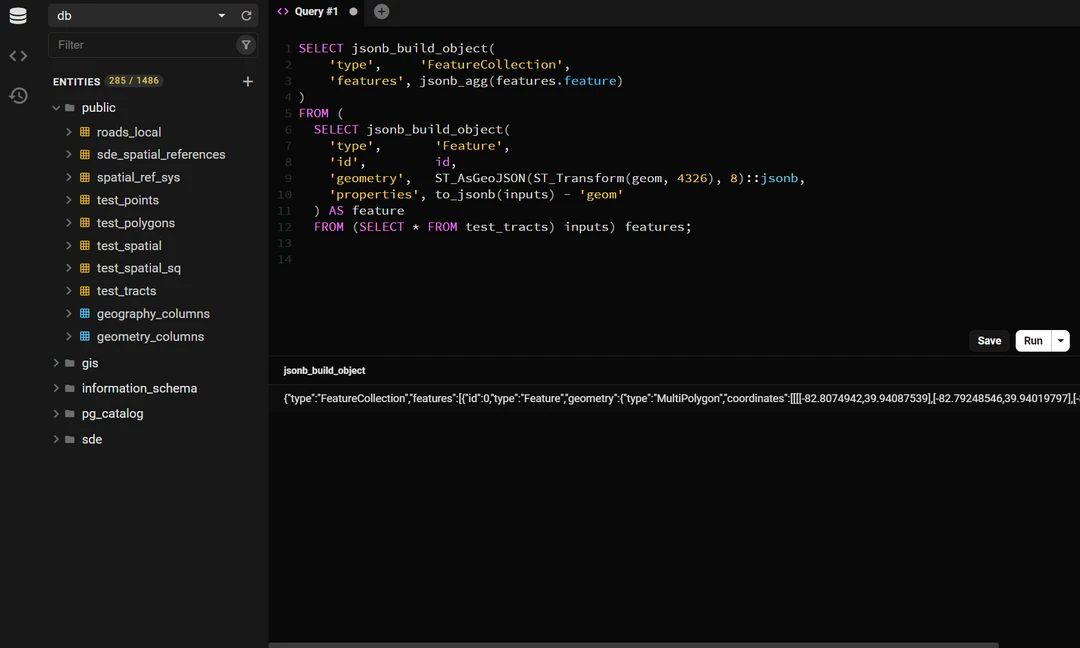
FOSS4G Image Processing
Creating Cloud Optimized GeoTIFFs and Raster Tiles using GDAL and QGIS
Tech Blog | Read More →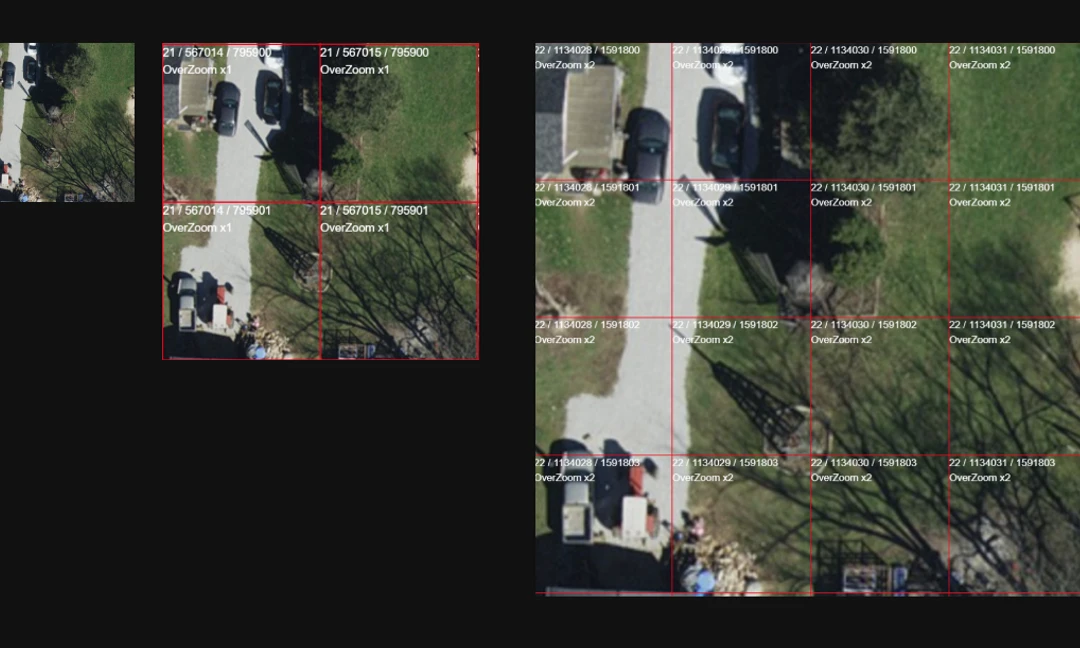
Generating Cloud Optimized GeoTIFFs and Raster Tiles with GDAL
TL;DR gdalbuildvrt, gdal_translate, gdal_warp and gdaladdo
Tech Blog | Read More →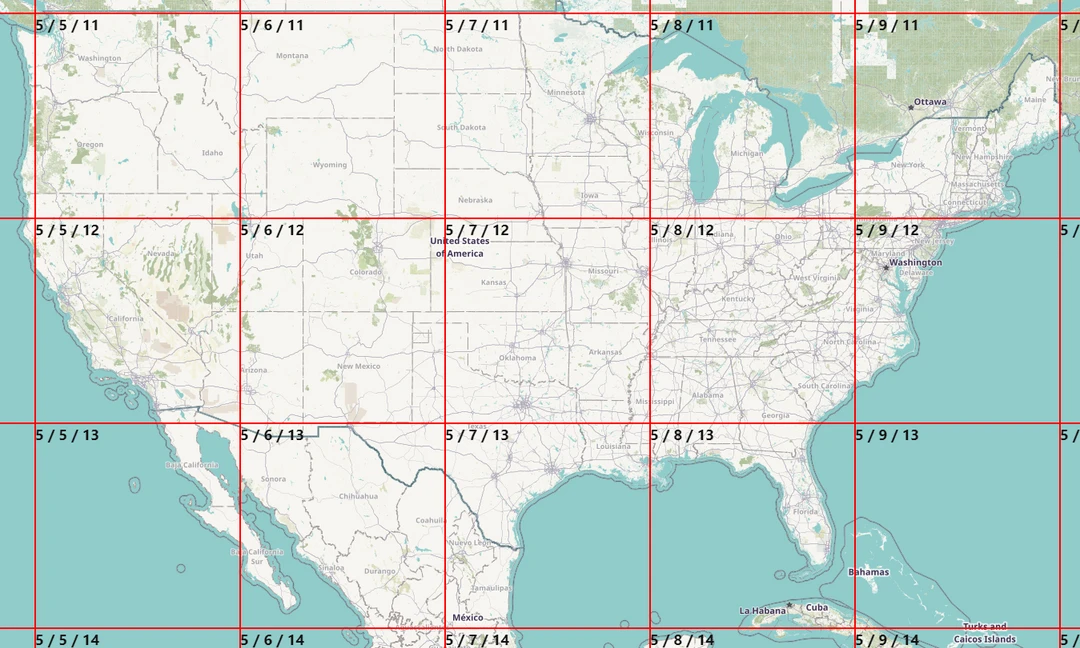
Wedding Website
A Single-Page Wedding Wedsite with an Interactive Map
Tech Blog | Read More →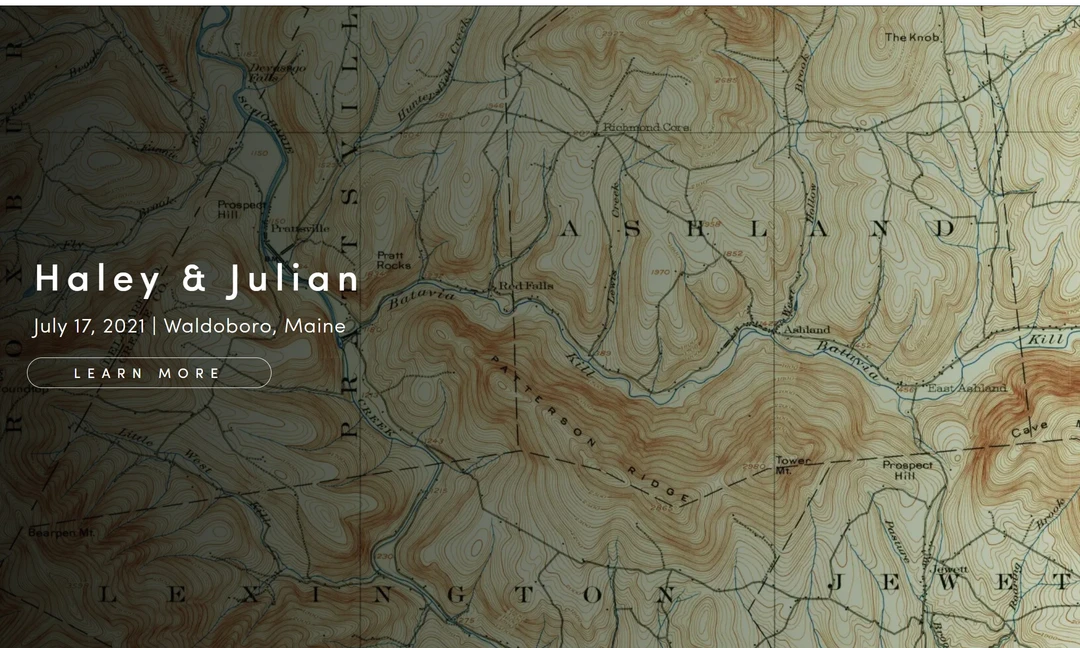
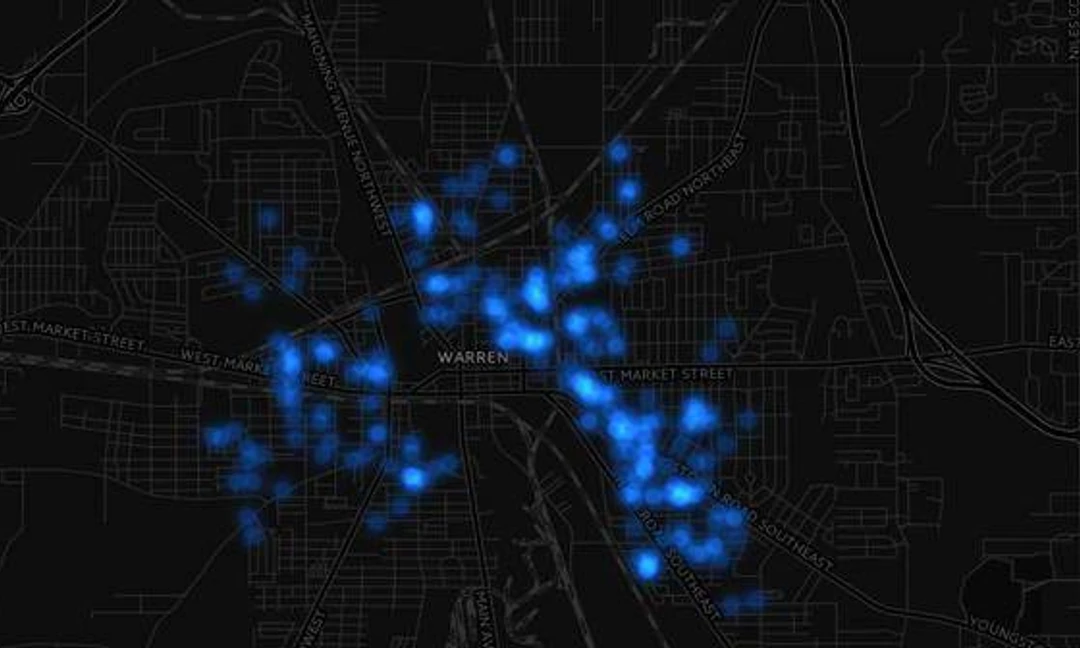
Pandemix Data Visualization
What if all US COVID Deaths occurred in one geographic area?
Tech Blog | Read More →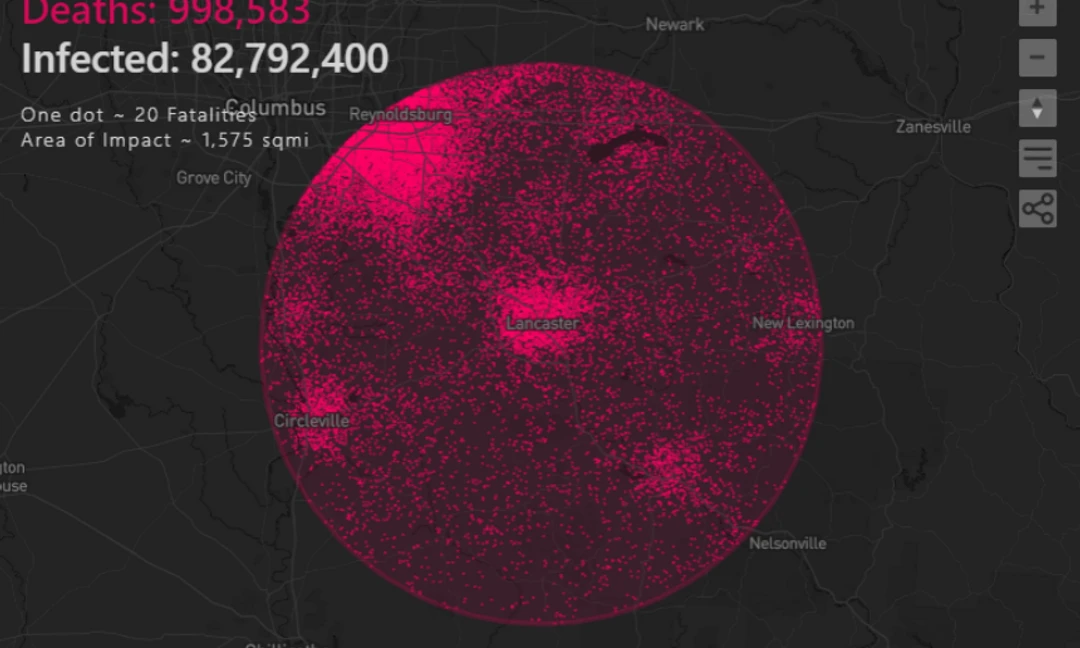
From the Ashes of Shapefiles
A Presentation for the 2020 Virtual Ohio GIS Conference
Tech Blog | Read More →
GIS and Remote Work
An Exploration of a GIS Remote Work Toolkit
Tech Blog | Read More →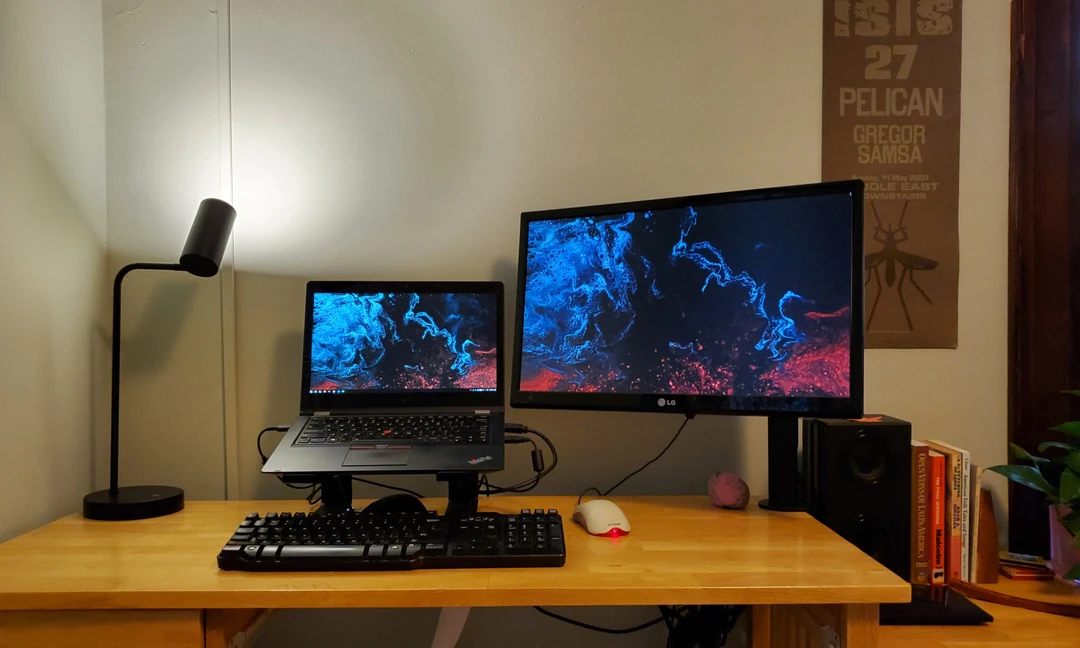
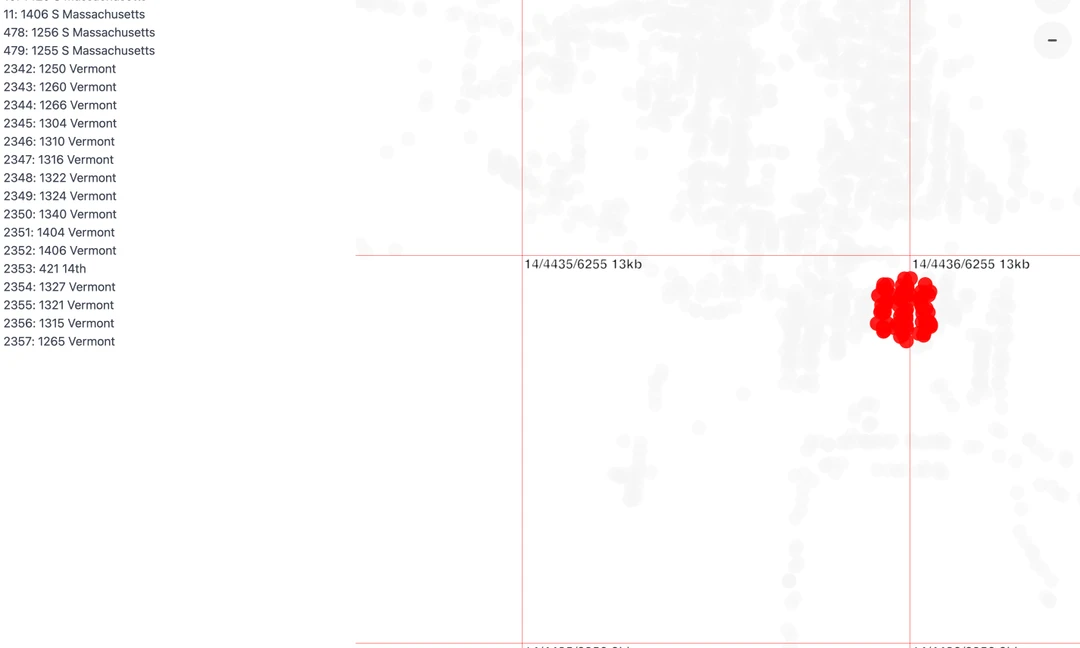
Exporting AGOL Feature Services to GeoJSON
Using NodeJS and Batches to Transform an ArcGIS Online Feature Service to GeoJSON
Tech Blog | Read More →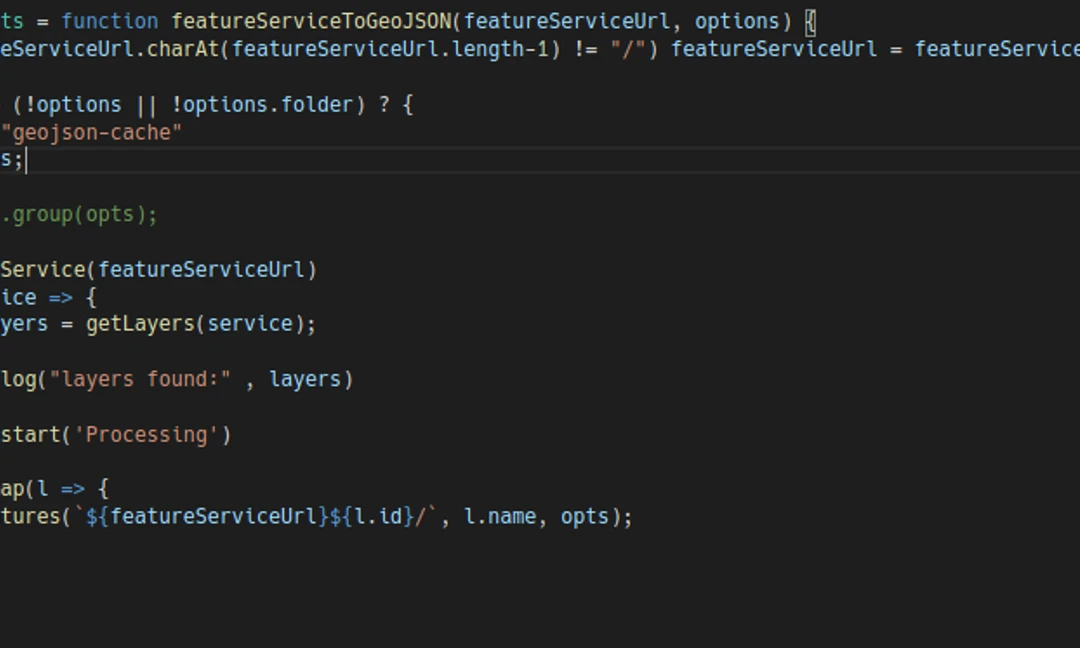
Ohio COVID-19 Dashboard
A Simple, Client Side Tracking Dashboard for COVID-19 in Ohio
Tech Blog | Read More →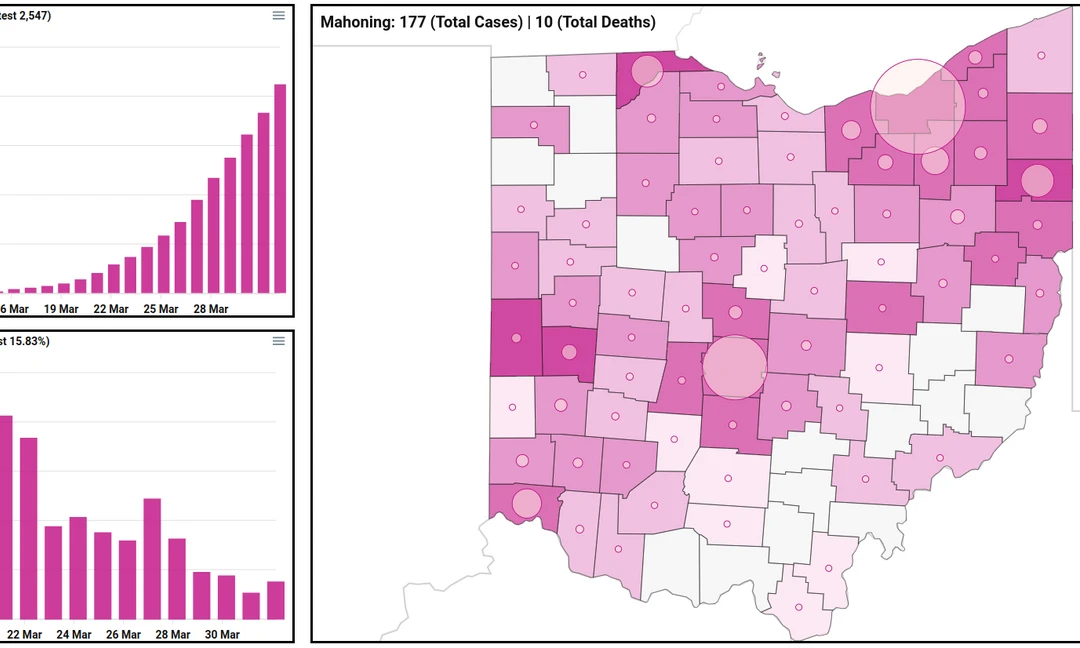
RTK to WGS84
Transforming Coordinates with JavaScript using proj4.js
Tech Blog | Read More →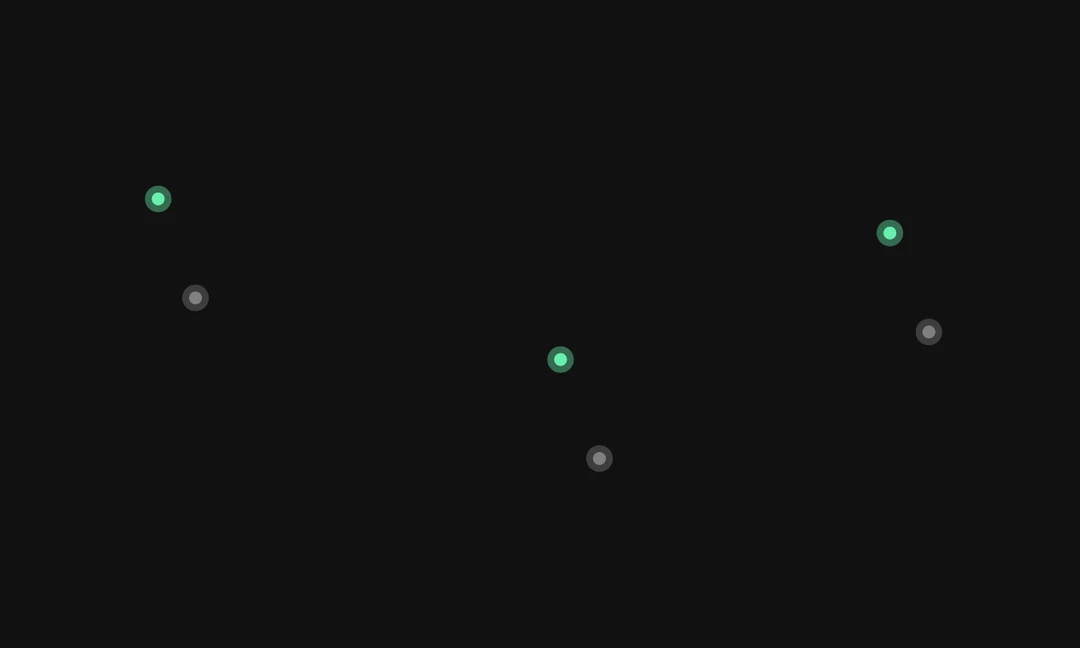
Highlighting Features in Mapbox GL JS
A Comparison of Filter and Feature-State
Tech Blog | Read More →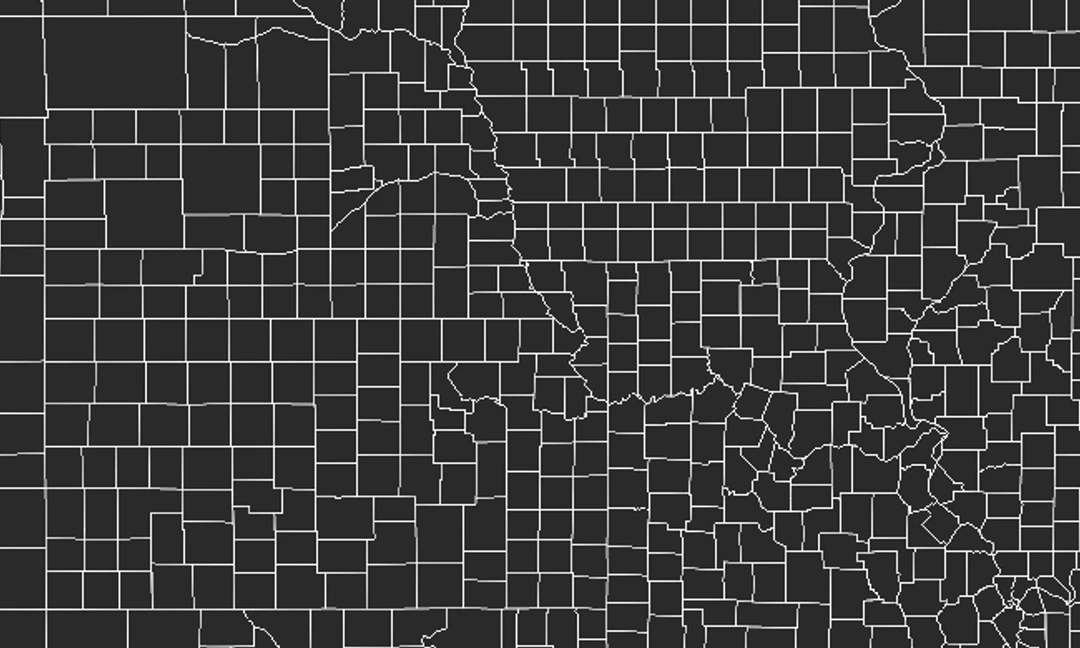
Network Tracing with Turf JS
A Client Side Solution for Simple Upstream and Downstream Linear Network Analysis
Tech Blog | Read More →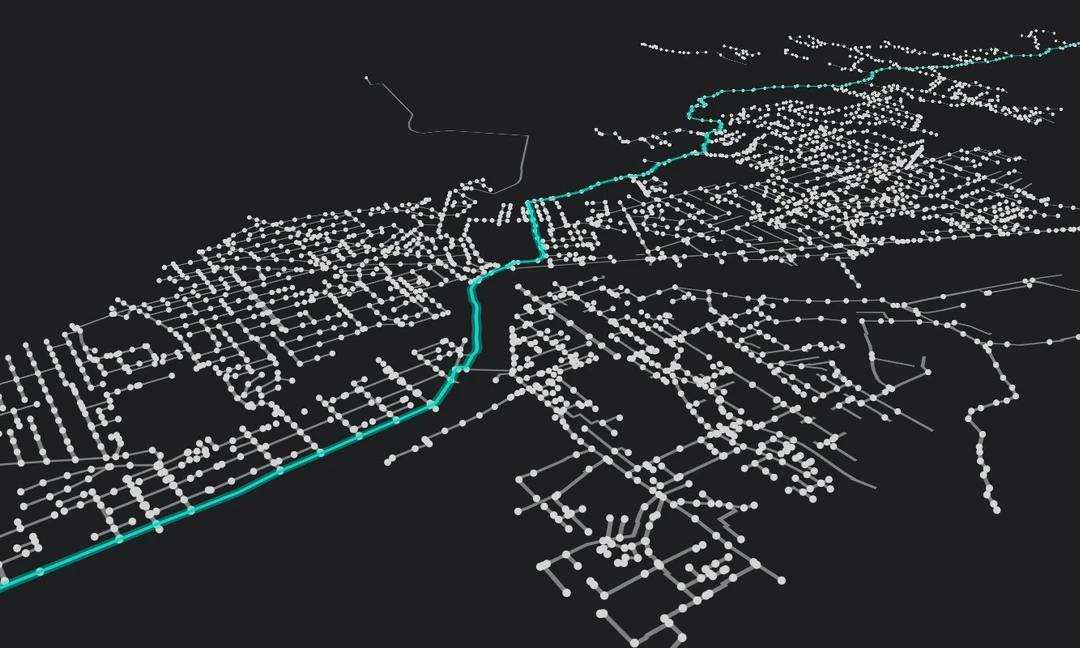
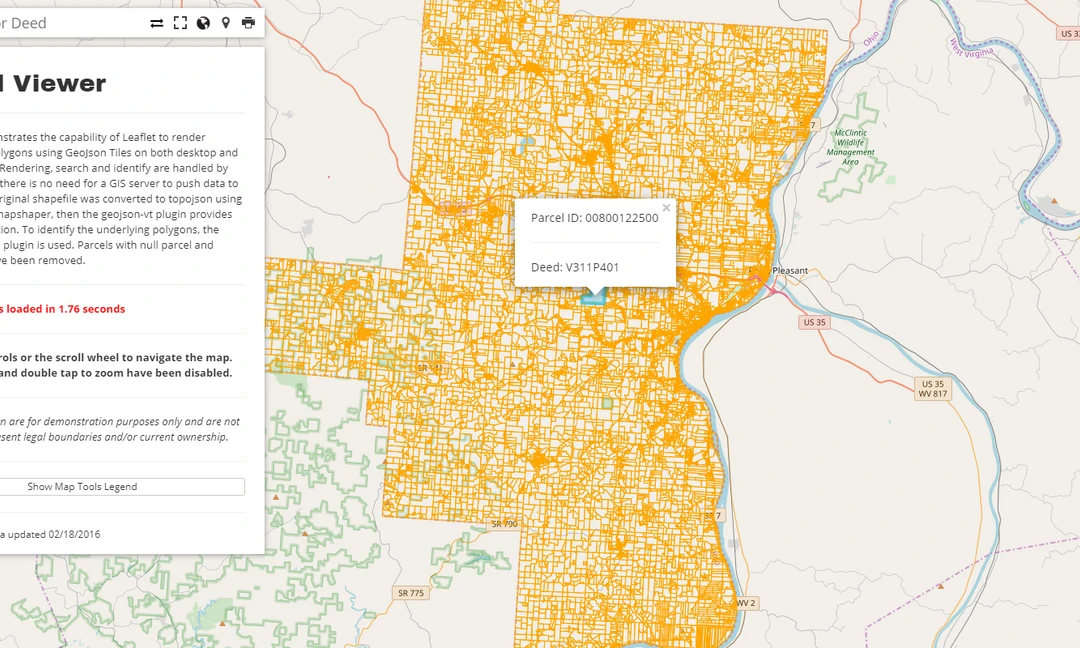
Open Parcel Viewer
A Client-Side Parcel Viewer built with Leaflet
Tech Blog | Read More →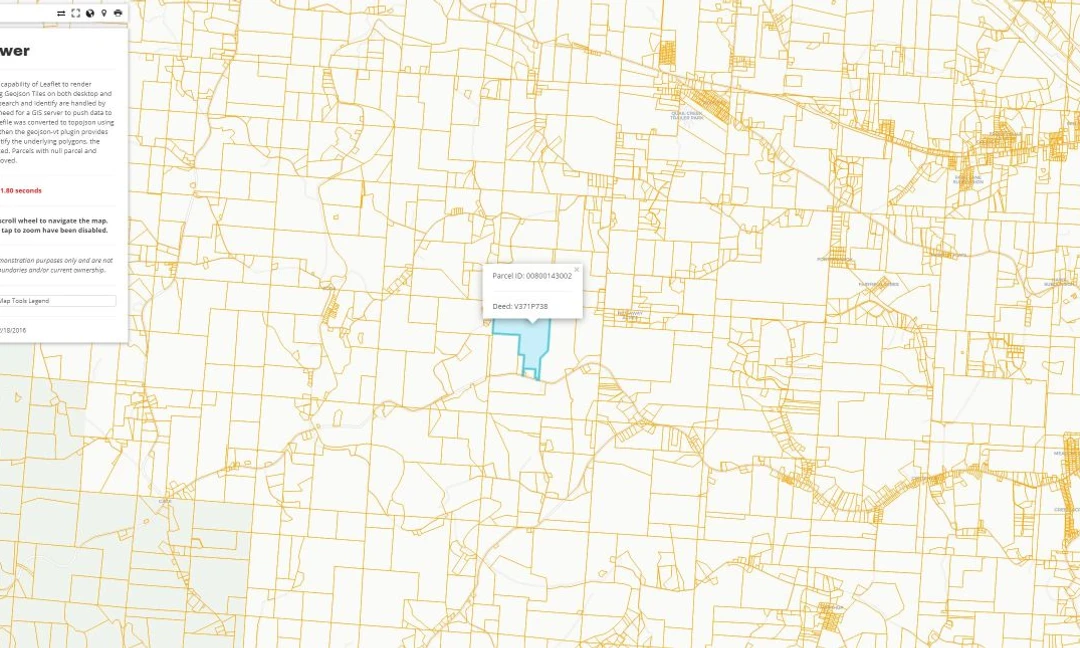
Leaflet Store Locator
A Leaflet Version of the Original Mapbox JS Store Locator Example
Tech Blog | Read More →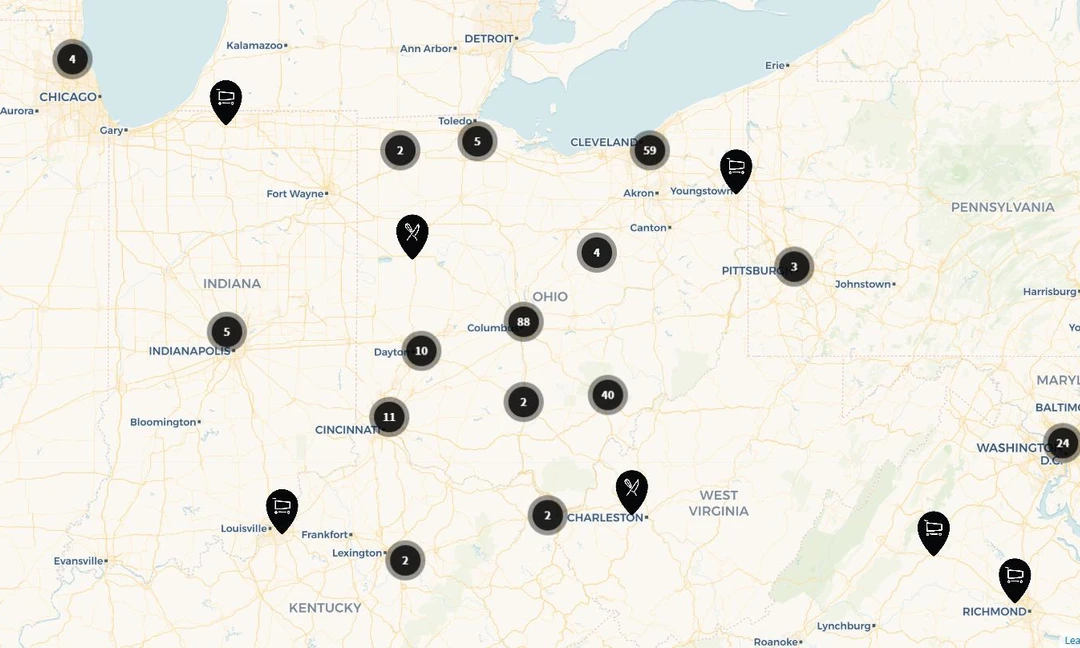
Intro to Turf JS
Geospatial Analysis for the Browser, Desktop & Server
Tech Blog | Read More →
Data-Driven Styling, 3D Polygons & Vector Tiles with Mapbox GL JS

Web Maps from Scratch
An Introduction to Leaflet, GitHub & Jekyll
Tech Blog | Read More →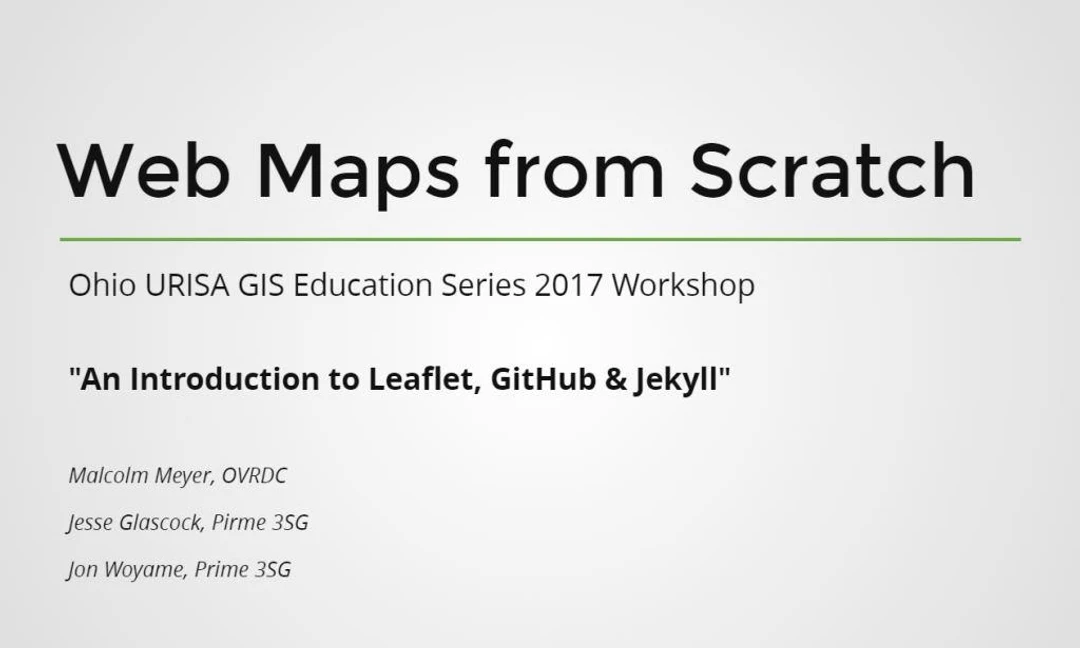
Leaflet & GeoJson Tiles
A County Parcel App: No GIS Server? No Problem!
Tech Blog | Read More →
Shagbark Product Locator Map
A Locator Map with Search and Nearest Store Finder
Tech Blog | Read More →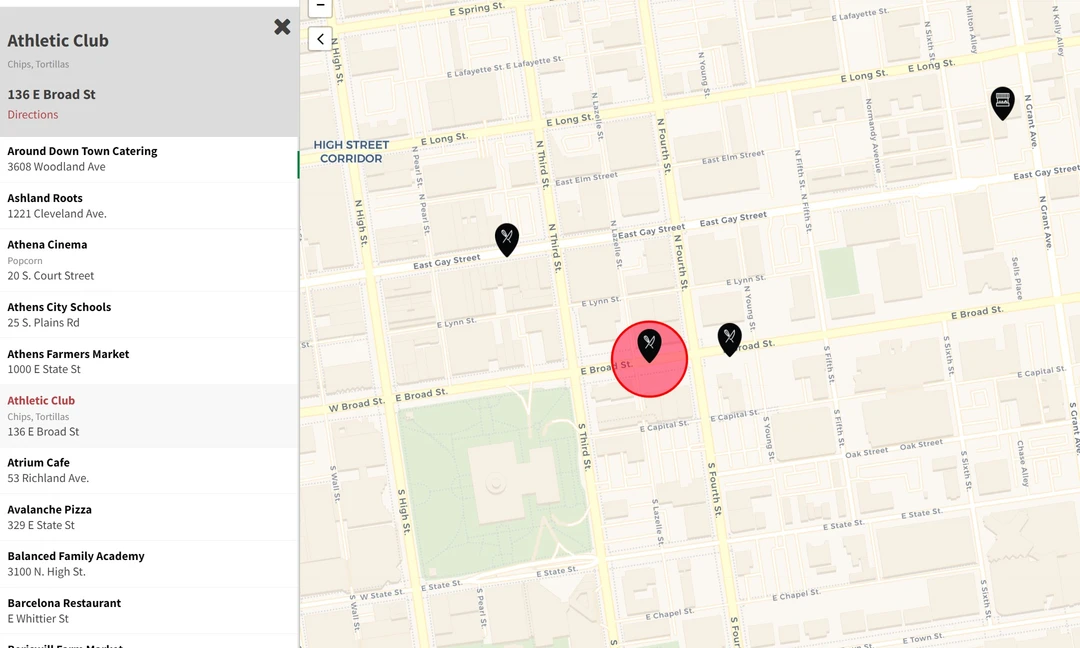
Intro to Leaflet
A Presentation for the 2015 Ohio GIS Conference
Tech Blog | Read More →